FIGURE 12.
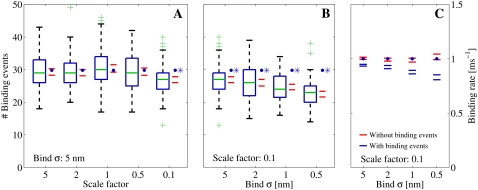
(A and B) Number of registered binding events from 100 runs each, where we altered different parameters. The data were collected from a receptor 30 nm from the center and are represented by the box-plots together with a 95% confidence interval for the true means (red horizontal lines). The blue solid circles represent the expected number of binding events that are predicted by the continuous model. (A) We scaled the number of Ca2+ ions that enter the cleft, i.e.,  together with the diffusion constant D, with a factor represented by the x axis. The spatial resolution was constant for these simulations, σ = 5 nm. The blue asterisk denotes a statistical difference between the continuous model and the RW model for scale = 0.1. (B) We kept the scale constant at 0.1, but altered the spatial resolution (see the x axis). Here, the difference between the RW model and the continuous model increased as the mean value of the collected binding events declined with the spatial resolution. (C) We ran the simulation 100 times. We collected the mean binding rates for each run that the receptor were exposed to. The data from each set of 100 runs are presented as 95% confidence intervals for the true means. The blue horizontal lines represent the binding rates collected from runs in which we registered binding events, as in panel B. The red horizontal lines represent binding rates collected from runs in which we did not register binding events, only the rate. In these runs we could not differentiate statistically between the registered binding rates and the rates predicted from the continuous model.

