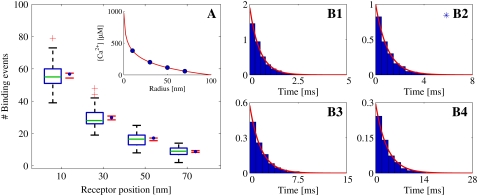
FIGURE 8.
Statistical data for binding events registered from Random Walk simulations with one open LCC, which acted as the Ca2+ source, situated in the center of the cleft. The binding events are registered at four different RyRs, positioned at 10, 30, 50, and 70 nm from the center of the cleft. Binding events are collected from 100 simulation runs. The registration started when the [Ca2+] had reached the steady state. The total time simulated was 30 ms. (A) Box-plot of the number of binding events from the runs at each receptor, together with a 95% confidence interval for the true means (red horizontal lines). The blue solid circles represent the expected number of binding events predicted by the continuous model. These values were computed on the basis of the fixed [Ca2+] at each receptor (see inset). In the box-plot, the green line represents the median of the data and the blue horizontal lines the limit of the upper and lower quartiles. The whiskers, i.e., the black lines extending from the blue boxes, represent the rest of the data up to a maximum length of 1.5 times the size of the two center quartiles. The green plus-signs are outliers. (B1–B4) Inter-event intervals (IEIs) from all runs presented in scaled histogram plots, corresponding to the receptor at positions 10, 30, 50, and 70 nm from the center of the cleft. The heights of the bars are scaled so the total area of a whole histogram = 1. The red lines show the probability distribution of the IEI from an homogeneous Poisson distribution with a rate based on the steady-state value of the [Ca2+] at the receptor. The blue asterisk indicates a significant difference, at 5% level, between the collected IEIs and the corresponding exponential function using a Kolmogorov-Smirnov test.

