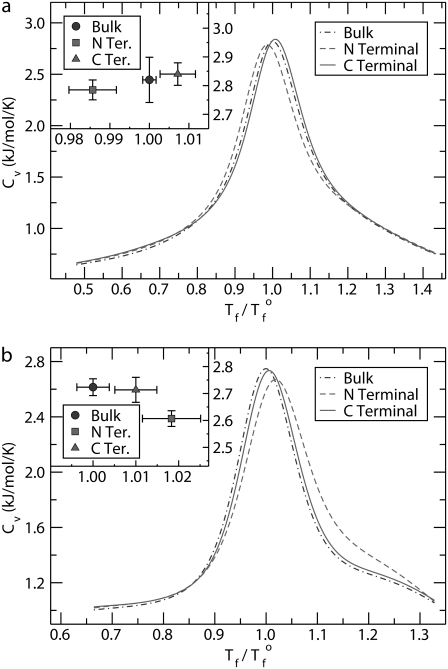
FIGURE 3.
Heat capacity as a function of temperature for (a) protein A and (b) SH3 in three different environments: bulk and tethered to a hard surface at the N- and C-termini. The inset shows the values of the peaks for each case and the associated errors. The temperature is normalized with respect to the transition temperature of the peptide in bulk, Tf°.

