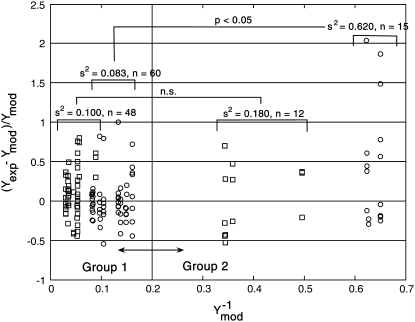
FIGURE 4.
Analysis of the NTFA and EMSA residuals to construct appropriate error models. The difference between experimental measurement (yexp) and simulated response (ymod) of active nuclear NF-κB (residual error) after LPS stimulation in IC-21 macrophages is shown as a function of  EMSA measurements are shown as circles and NTFA measurements as squares. The residual errors are normalized by the simulated response. EMSA residuals with
  were assigned to EMSA Group 2, and remaining residuals were assigned to EMSA Group 1. Similar grouping was applied to the NTFA residuals. Variances for each group are shown in the figure. The difference in variance between NTFA groups was not significant, whereas the EMSA groups exhibited significant differences in variance (p < 0.05).

