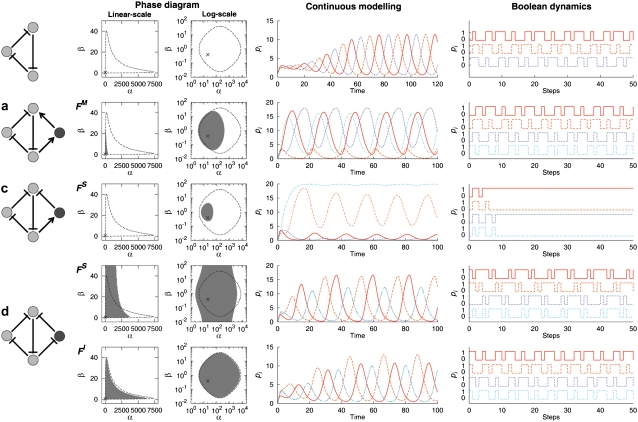
FIGURE 3.
Dynamic characteristics of the original three-node repressilator (top row) and the four-node extended repressilators a–d. The phase diagram in (α, β) parameter space with α0/α = 10−3 and n = m = 2 is shown for each oscillable configuration and regulation function, both in linear and logarithmic scales, for clarity. Labeling of the panels follows that of Fig. 1. The configuration b is not shown since it does not support the sustained oscillations for any parameter set investigated. The configuration d is shown for each of the regulation functions of the form FS (fourth row) and FI (fifth row). The gray region in the phase diagram indicates the cases where the sustained oscillation occurs in the extended system and the region enclosed by the black-dotted curve denotes the cases where the sustained oscillation occurs in the original three-node repressilator, shown for comparison. Also shown is the temporal profile of the continuous modeling with the parameters α = 20 and β = 0.4 (marked by “×” in the phase diagram). Each curve shows the profile of the node N1 (red solid), N2 (orange dashed), N3 (blue dotted), and N4 (cyan dash-dotted), respectively. Note that trajectories of N3 and N4 overlap in d. Typical temporal profiles for the corresponding Boolean dynamics are shown in the rightmost column. The color-coding of the Boolean dynamic profiles follows that of the continuous modeling.

