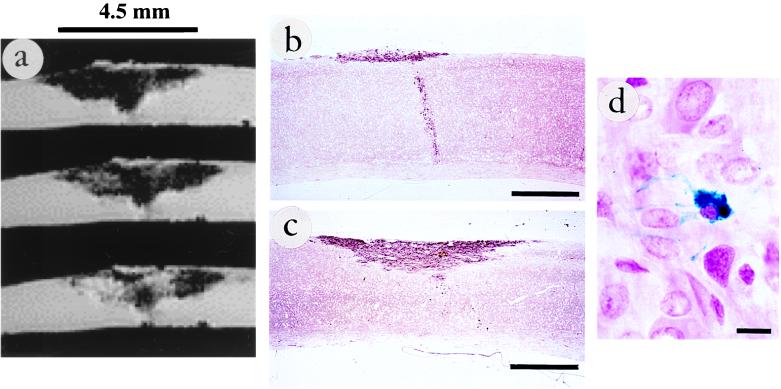
Figure 4.
Md rat 14 days after transplantation. Shown is the sagittal MRI plane for TE = 6 msec (a, consecutives slices) at 78-μm isotropic resolution, with cellular migration over a distance of 4.5 mm. The antiproteolipid protein immunolabeling (b and c) show that the observed MRI contrast corresponds closely to the myelination. In b, note the injection track with cell migration toward the dorsal column (the spherical appearance of the injection track in the MR images is the result of its direction relative to the orientation of the external magnetic field gradient). Prussian blue-positive cells (d) in the area of new myelination resembled the cellular morphology of oligodendrocytes. (Bars represent 1 mm in b and c and 10 μm in d.)

