Figure 1.
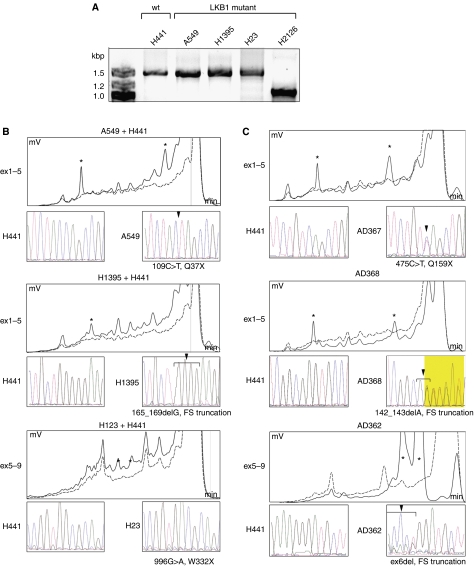
Mutation analysis of LKB1 gene in NSCLC cell lines and tumours. RT–PCR amplification of cDNA from LKB1 wt (H441) and LKB1 mutant (A549, H1395, and H23) cell lines display the full length LKB1 mRNA (1.4 kbp) while the LKB1 mutant cell line, H2126 with a deletion of exons 4–6 expresses a shorter mRNA (1.0 kbp) (A). HPLC tracings of SURVEYOR-WAVE mutation analysis of NSCLC cell lines A549, H1395, or H23 (continuous line), and H441 (dashed line). Time in minutes is shown on the X-axis, voltage in mV on the Y-axis (B). A549 and H1395 show novel peaks (*) in the amplicon covering exons 1–5 (ex1–5) corresponding to 109C>T, Q37X and 165_169delG, frameshift and truncation (FS truncation) mutations. The analysis from H23 demonstrates novel peaks in the amplicon covering exons 5–9 (ex5–9) corresponding to 996G>T, W332X mutation. LKB1 wild-type cDNA (H441) was added to PCR products 1 : 1, denatured by heating and slowly renaturated to generate heteroduplexes since A549, H1395, and H23 have previously reported to be homozygous for the LKB1 mutations. SURVEYOR-WAVE mutation analyses of NSCLC tumours (C). AD367 and AD368 tumours showed novel peaks in the ex1–5 amplicon corresponding to 475C>T, Q159X, and 142_143delA, FS, truncation mutations. AD362 tumour had novel peaks in ex5–9 amplicon corresponding to deletion of exon 6. Mutant sequences for AD367 and AD368 are displayed from sequences using the forward primer while mutation of the AD362 is showed with reverse primer.

