
Figure 2.
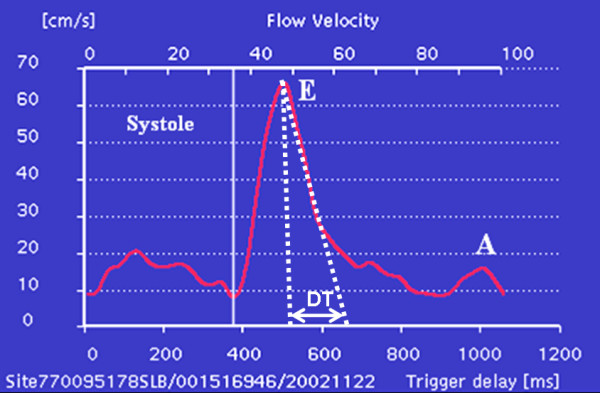
Demonstration of obtaining DT from the CMR mitral valve flow data. On the CMR flow curve a vertical line was drawn from the peak of E wave to intersect the baseline, which displayed time delay at which the E wave peak occurred. A second line was drawn from the peak of the E wave following the downslope intersecting the baseline, which gave the time delay of the E wave downslope. The time delay of the peak E wave was subtracted from the time delay of the E wave downslope intersecting the baseline to calculate the DT.