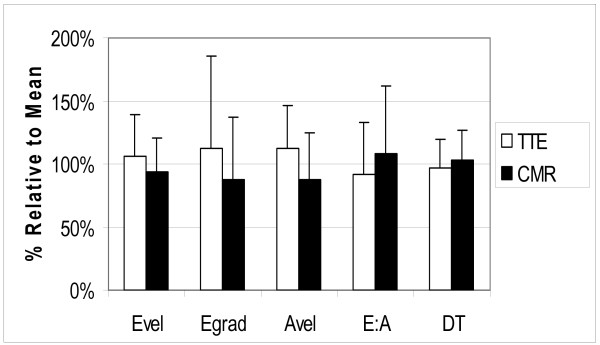
Figure 4.
Comparison of normalized TTE and CMR parameters: plotted are the average values (expressed as a percentage of the mean) for each parameter, where Evel is maximal "E" velocity, Egrad is the gradient derived from Evel, Avel is maximal A velocity, E:A is the ratio of maximal E and A velocities and DT is deceleration time.

