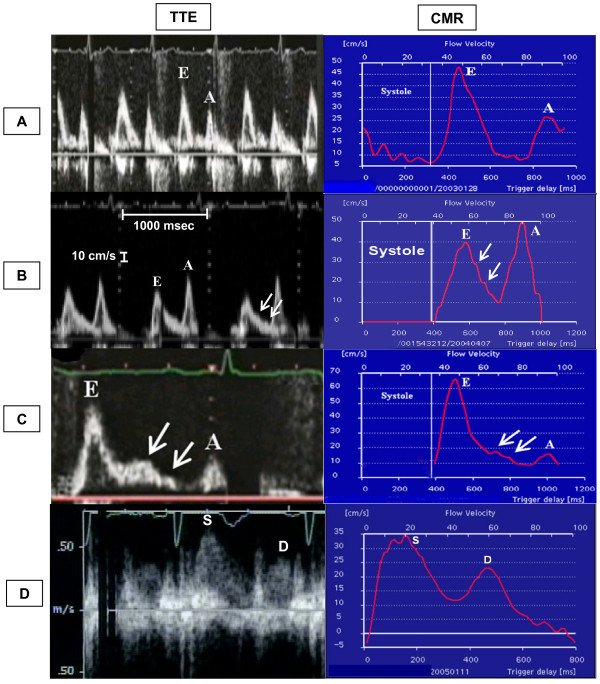
Figure 8.
Morphological representation of velocities obtained by TTE and CMR. Note comparability between TTE and CMR representation of E and A waves with respect to their magnitude and temporal presentation in diastole. The x axis of the TTE panel is labeled on panel B figure and was calibrated to 1000 msec between two vertical dotted lines for all the patients and the y axis is represented by the smaller distance between the dots of the vertical dotted lines and was calibrated to 10 cm/sec for all patients. The y axis calibration for pulmonary vein flow (panel D) was different from the transmitral flow and is shown on the image; however, the x axis calibration was similar. Panel A demonstrate normal E:A ratio and deceleration time (DT). Panel B shows impaired relaxation with prolonged DT and a high A wave. Panel C demonstrates a restrictive pattern with short DT and an elevated E:A ratio. Note diastasis points (arrows) illustrating the similarities in depiction of flow features. In panel D the flow velocity profile obtained by CMR of right superior pulmonary vein is similar to that obtained with TTE (S and D are the systolic and diastolic waves of the pulmonary vein).

