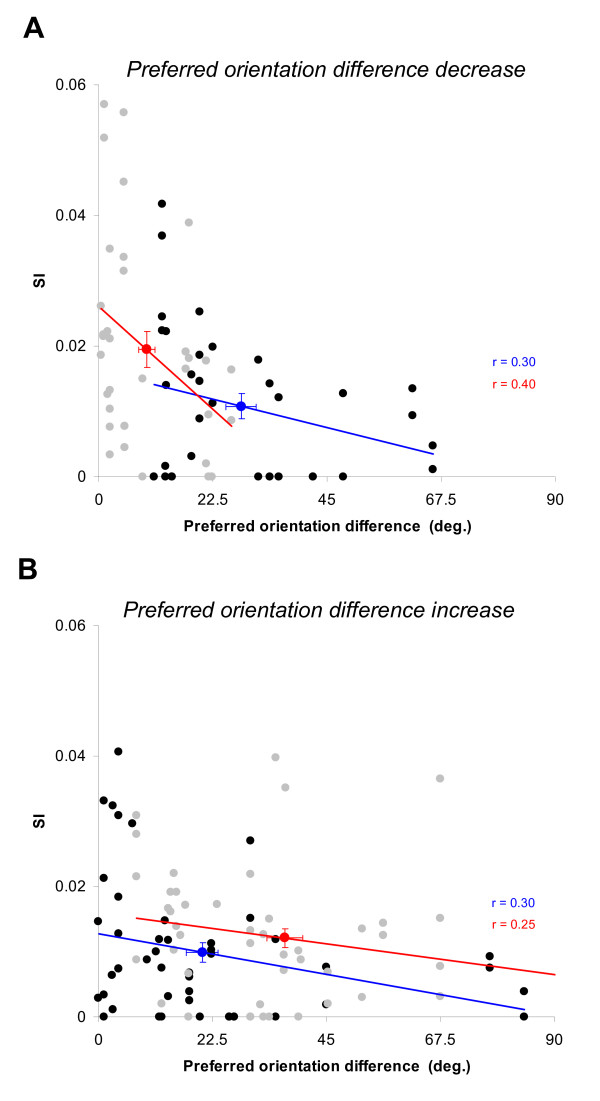
Figure 7.
Relationship between the preferred orientation difference of cells and synchrony strength. (A) A decrease in preferred orientation difference after adaptation induced a significant rise of the synchrony strength (n = 34 SI values, paired sample two-tailed t-test, p < 0.001). (B) An Increase in preferred orientation difference after adaptation induced no significant rise of the synchrony strength (n = 48 values, paired sample two-tailed t-test, p > 0.1). The black and grey dots represent the control and the adaptation values, respectively. Linear regressions show that there is a negative relationship between the preferred orientation difference and synchrony in each condition (correlation coefficients are indicated for both group). The bolded blue and red dots correspond to the mean values of preferred orientation difference and the synchrony strength (errors bars in both x and y axis are SEM). Note that the preferred orientation difference was calculated using curve fits. In both case, the preferred orientation difference was significantly different between the control and the adaptation condition (paired sample two-tailed t-test, p < 0.0001).

