Figure 1.

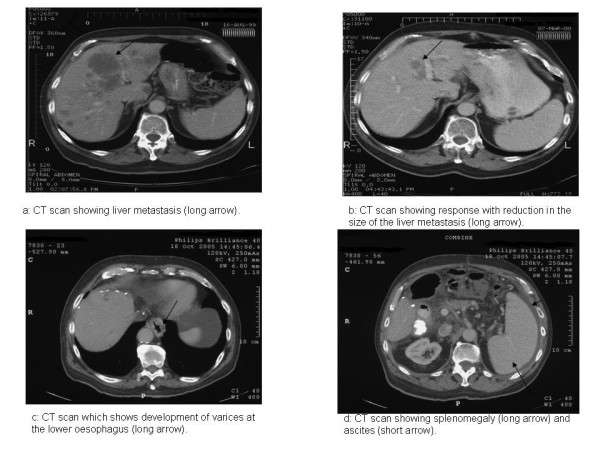
CT scans. (a) Liver metastasis (long arrow). (b) Response with reduction in the size of the liver metastasis (long arrow). (c) Development of varices at the lower oesophagus (long arrow). (d) Splenomegaly (long arrow) and ascites (short arrow).
