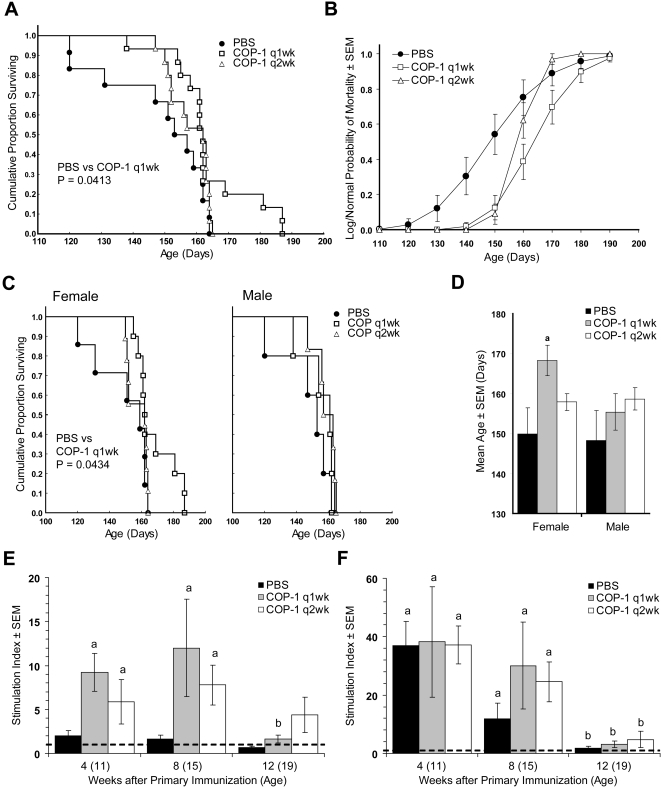
Figure 1. Effect of COP-1 immunization in B6 SOD1 mice.
Mice were treated with PBS (closed circles and black bars), COP-1 weekly (q1wk) (open boxes and gray bars), or COP-1 every 2 weeks (q2wk) (open triangles and white bars). (A) Kaplan-Meier analysis of the proportion of surviving SOD1 Tg mice as a function of age. Cox's F-test comparison showed groups treated with PBS vs COP-1 q1wk (p = 0.0413) or COP-1 q2wk (p = 0.1151), and COP-1 q1wk vs COP-1 q2wk (p = 0.1673). (B) Log-normal analysis of mortality probability at 10 day intervals for mice treated with PBS, COP-1 q1wk, COP-1 q2wk. (C) Kaplan-Meier plot of the proportion of surviving female SOD1 Tg mice (left panel) or male SOD1 Tg mice (right panel) as a function of age showing the gender effect. Cox's F-test comparison showed female mice groups treated with PBS vs COP-1 q1wk (p = 0.0434) or COP-1 q2wk (p = 0.2449), and COP-1 q1wk vs COP-1 q2wk (p = 0.0846) and male mice groups treated with PBS vs COP-1 q1wk (p = 0.4240) or COP-1 q2wk (p = 0.1615), and COP-1 q1wk vs COP-1 q2wk (p = 0.1430). (D) Mean age of survival±SEM for 7–10 female or 5–6 male SOD1 Tg mice/group treated with PBS, COP-1 q1wk, or COP-1 q2wk. aP<0.05 compared to PBS treated mice with Bonferroni post-hoc tests. Spleen cells from B6 Tg mice treated with PBS, COP-1 q1wk, or COP-1 q2wk were stimulated with (E) Cop-1 (5 µg/ml), (F) Con A (2 µg/ml) or cultured in media alone. Cells were pulsed with [3H]-TdR for the final 18 hrs of culture, harvested onto glass fiber filters and counted by β-scintillation spectrometry. Counts were normalized as a ratio of those obtained from culture in media alone to generate a stimulation index for spleen cell proliferation from each animal. A stimulation index of 1 is defined by spleen cells cultured in media alone (dashed line). Means of stimulation indices (±SEM) were determined from 4–5 mice/group for (E) antigen-specific proliferation elicited by Cop-1 and (F) polyclonal T cell proliferation induced by the T cell mitogen, Con A. aP<0.05, above media control (stimulation index = 1, dashed line); and bP<0.05 compared to weeks 4 or 8 within each treatment group.

