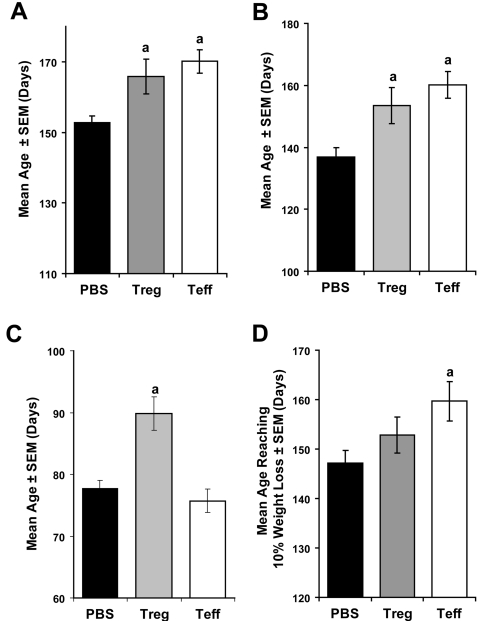
Figure 8. Effect of Treg and Teff on mean age of survival, clinical scores and weight loss in B6 G93A-SOD1 Tg mice.
B6 G93A-SOD1 mice were treated with PBS (black bars), 1×10⁶ activated Treg (gray bars), or 1×10⁶ activated Teff (white bars) at 7, 13, and 19 weeks of age. (A) Mean age of survival±SEM for 14–15 SOD1 Tg mice/group treated with PBS (152.7±2.0 days), Treg (165.8±5.0 days), or Teff (170.1±3.4 days). aP<0.04 compared to PBS-treated mice by ANOVA and Bonferroni post-hoc tests. (B) Mean age±SEM for SOD1 Tg mice reaching late stage (clinical score = 1) after treatment with PBS (136.9±3.1 days), Treg (153.5±5.8 days), or Teff (160.1±4.3 days). aP<0.04 compared to PBS control group by ANOVA and Bonferroni post-hoc tests. (C) Mean age±SEM for SOD1 Tg mice at disease onset (clinical score = 3) after treatment with PBS (77.7±1.3 days), Treg (89.8±2.7 days), or Teff (75.7±1.9 days). aP = 0.0003 compared to PBS control group by ANOVA and Bonferroni post-hoc tests. (D) Mean age±SEM for SOD1 Tg mice that exhibit a reduction of maximum body weight ≥10% after treatment with PBS (147.2±2.5 days), Treg (152.8±3.7 days), or Teff (159.7±4.0 days). aP<0.04 compared to PBS control group by ANOVA and Bonferroni post-hoc tests.

