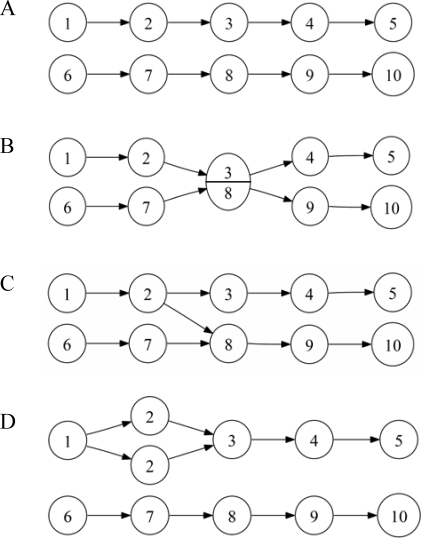
Figure 1. Graphical representation of two-pathway networks.
Circles represent nodes, arrows their connections, and numbers the functions performed by the nodes. Nodes 1 and 6 are input nodes and nodes 5 and 10 are output nodes. A) The simplest case, or null model, constituted by two separate pathways of length five each. B) An example of multi-functionality: functions 3 and 8 are collapsed into a single node, which implies that a mutation at this node will inactivate both pathways. These two functions are physically linked but otherwise independent, meaning that the flow through the two pathways remains separated. C) Increased connectivity, through the addition of an extra edge. The extra edge between nodes 2 and 8 implies that the output produced by node 2 enters the lower pathway. Thus, mutations occurring at the lower pathway upstream of node 8 have no effect, provided the upper pathway is not mutated upstream of node 3. D) An example of redundancy: node 2 is duplicated, making single mutations at this node silent. A second mutation at node 2 has a 50% probability of being silent, depending on whether it hits the previously damaged copy or the intact one.

