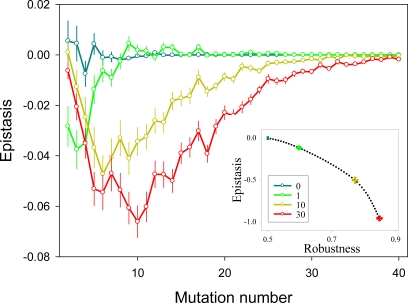
Figure 3. Effect of connectivity on epistasis in two-pathway networks.
Increasing numbers of extra edges (0, 1, 10, 30) were allowed (color legend), which consequently increases connectivity (c = 0.8, 0.9, 1.8, and 3.8, respectively). For each connectivity value, 1000 networks were created, choosing extra edges at random. For each network, 1 to 40 mutations were introduced. The main graph reports average epistasis values±SEM. The inset graph shows the correlation between robustness and total epistasis. Total epistasis and robustness were computed as detailed in Fig. 2 legend.

