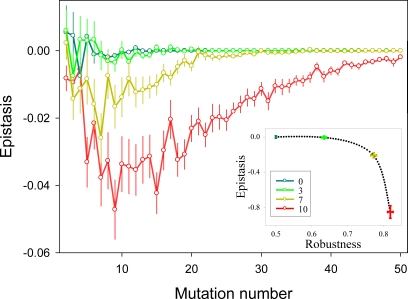
Figure 4. Effect of redundancy on epistasis in two-pathway networks.
Increasing numbers of duplicates (0, 3, 7, 10) were introduced (color legend). For each redundancy level, 1000 networks were created, choosing duplicates at random (nodes could be duplicated more than once). For each network, 1 to 50 mutations were introduced. The main graph reports average epistasis values±SEM. The inset graph shows the correlation between robustness and total epistasis. Total epistasis and robustness were calculated as detailed in Fig. 2 legend.

