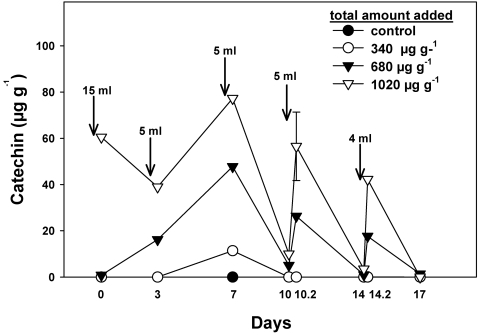
Figure 2. Measured concentrations of (±)-catechin in soil from India, derived from the application of pulsed deliveries of different concentrations shown in the legend.
Values on x-axis denote the days on which sampling was conducted. In detail, “10” and “14” denote sampling prior to the application of (±)-catechin pulses on those days, and “10.2” and “14.2” denote sampling two hours after application. The total (±)-catechin delivered to these soils over all pulses was 0, 340, 680, or 1020 µg g−1. The single error bar shown indicates the largest 1 SE.

