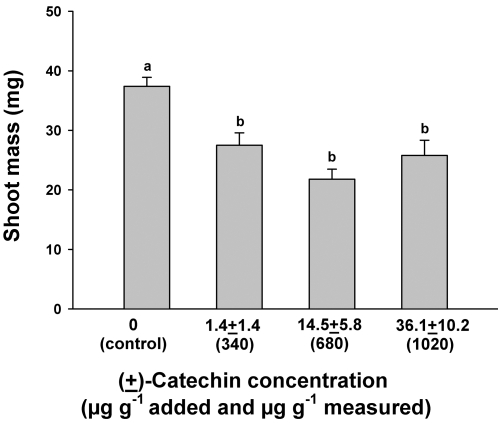
Figure 4. Shoot mass of Bambusa arundinacea seedlings exposed to different soil concentrations of (±)-catechin applied in multiple pulses.
The x axis shows total measured concentrations of (±)-catechin below the bars and the applied concentrations in parentheses. Bars show 1 SE and shared letters indicate no significant difference among means as determined by ANOVA with treatment and pot as fixed variables and post-ANOVA Tukey tests; P<0.05.

