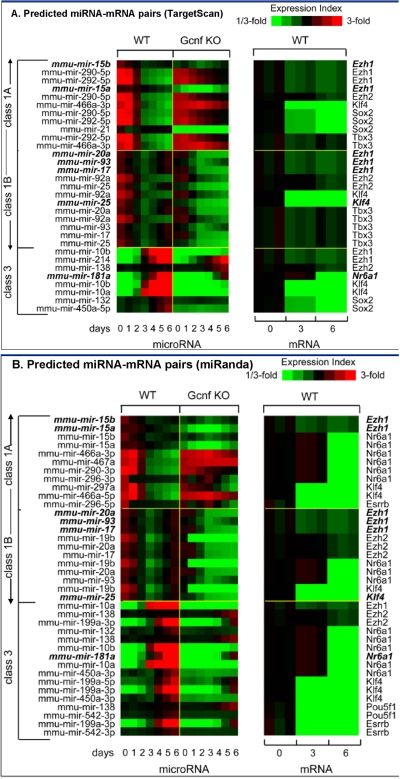
Figure 6. Relative expression profiles of predicted miRNA-mRNA pairs.
This figure shows results from microRNA microarray combined with mRNA data obtained through Affymetrix expression array profiling. Panel A shows miRNA-mRNA relationships based on TargetScan and Panel B shows miRNA-mRNA relationships based on miRanda. Here we see that in general Class 1 miRNAs are positively correlated in their expression trends as compared with their predicted targets. By contrast, Class 3 miRNAs are negatively correlated. Significant miRNA-mRNA relationships are determined through an enrichment analysis, which, is described in the methods section and results are shown in Table 1.

