Figure 1.
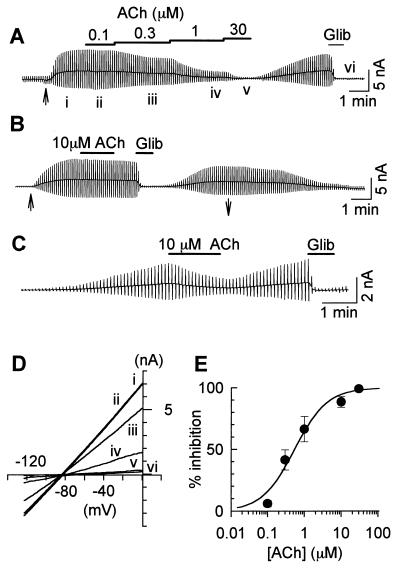
M1 receptor-mediated inhibition of the KATP current. Chart recordings of whole-cell current recorded in the COS7 cell cotransfected with Kir6.2, SUR2A, and M1 receptor cDNA. The current deflections are the results of ramp pulses. (A) The perfusion of 100 μM pinacidil started at the time indicated by the arrow (↑) under the current trace. The applications of ACh and 10 μM glibenclamide are indicated by the horizontal lines above the trace. (B) The whole-cell KATP current recorded in the COS7 cell that was not cotransfected with the M1 receptor. The perfusion of 100 μM pinacidil started at the time indicated by ↑ and finished at ↓ under the trace. (C) Spontaneous activation of the KATP current after the formation of the whole-cell patch using the pipette solution containing 10 μM ATP. (D) I–V relationships obtained at the times indicated by i–vi in A. The reversal potential was ≈−85 mV. (E) Concentration-inhibition relationship for ACh. The percent inhibition was plotted against ACh concentration. The following Hill equation is fitted to each data point: % inhibition = 100/{1 + (IC50/[ACh])nH}, where IC50 is the concentration for the half-maximal inhibition, and nH is the Hill coefficient. IC50 = 0.54 ± 0.12 μM, and nH = 0.98 ± 0.22 (n = 6). The line was drawn with these values.

