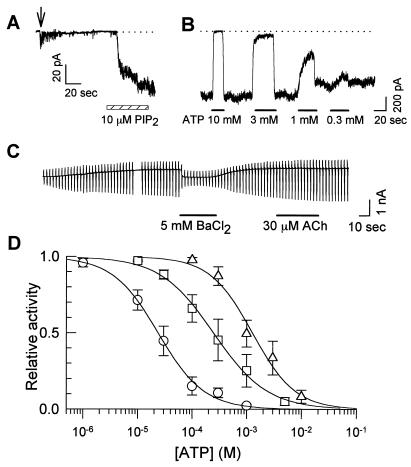
Figure 4.
The effect of exogenous PIP2 on the ATP sensitivity. (A) The time course of PIP2 activation in an inside-out patch experiment. The patch was excised at the time indicated by the arrow. PIP2 application is indicated by the hatched bar. (B) The inhibitory effect of ATP on KATP channels activated by PIP2. PIP2 (10 μM) was applied for 3 min before examining ATP sensitivity. The current traces in A and B were recorded in different patches. (C) The whole-cell KATP current activated by the pipette solution containing 100 μM PIP2. After the application of positive pressure [≈10 cmH2O (1 cm H2O = 88 Pa)], the KATP current started to occur. The holding potential was −20 mV. The ramp pulse was applied from −140 mV to 0 mV. BaCl2 (5 mM) was applied to examine the reversal potential (≈−85 mV). (D) Dose-inhibition curves for ATP. ○, Control; □, 40 s after the application of 10 μM PIP2. ▵, 3 min after 10 μM PIP2 application. The Hill equation fitted to data points is indicated in the legend of Fig. 5. IC50 values are indicated in the text.

