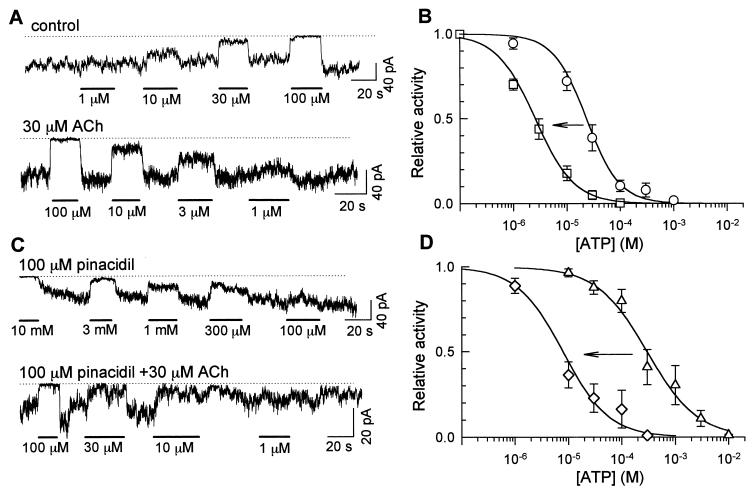
Figure 5.
Shift of the ATP sensitivity induced by M1-receptor stimulation. (A) Effects of various concentrations of ATP in the absence (Upper) and presence (Lower) of 30 μM ACh in the pipette solution. The dotted lines indicate the closed channel levels. ATP concentrations are indicated below the current traces. (B) Dose-inhibition relationships for ATP. ○, Control. □, 30 μM ACh in the pipette solution. (C) Effects of various concentrations of ATP measured in the presence of 100 μM pinacidil. Pinacidil was applied to the intracellular side of the patch membrane. Otherwise, the experiment is the same as A. (D) Dose-inhibition curves for ATP measured in C. ▵, 100 μM pinacidil alone; ⋄, 100 μM pinacidil plus 30 μM ACh in the pipette solution. (B and D) The Hill equation was fitted to each set data point: relative activity = 1/[1 + ([ATP]/IC50)nH]. The lines are drawn using the average values of IC50 and nH. IC50 values are shown in the text; nH values are not significantly different (0.9–1.4, P > 0.05), in both B and D.

