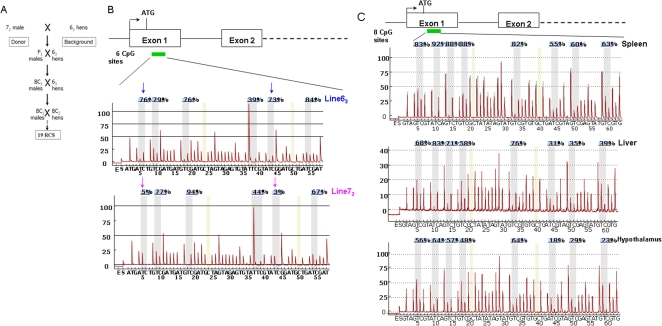
Figure 1. Schematic structure of developing the recombinant congenic strains (RCSs) and quantifying DNA methylation levels of DNMT3b and DNMT3a genes.
A. The strategies to develop the 19 RCSs from the background line 63 and donor line 72; B. Upper panel, methylation analysis region on the first exon of DNMT3b. Position of transcription start site (black arrow), translation start code (ATG) and exons (open boxes) based on NCBI database (ID NM_001024828). Green box shows the position of the analyzed 6 CpG sites. Lower panel, DNA methylation pyrograms of six CpG sites in the first exon of DNMT3b in line 63 and line 72 using Pyro Q-CpG system. Grey areas indicate the CpG sites that were analyzed. The yellow regions indicate internal control regions for automatic assessment of bisulfite conversion (unmethylated C should be fully converted to T). Blue arrows and pink arrows show the methylation contents in CpG sites 1 and 5 in line 63 and line 72, respectively. C. Upper panel, methylation analysis region of 8 CpG sites on the first exon of DNMT3a (NCBI ID: 10HNM_001024832). Lower panel, DNA methylation pyrograms of 8 CpG sites in the first exon of DNMT3b in spleen, liver and hypothalamus. The percentages in each CpG site is the methylation percentage of mC/(mC+C) on this site. mC: methylated cytosine, C: unmethylated cytosine.

