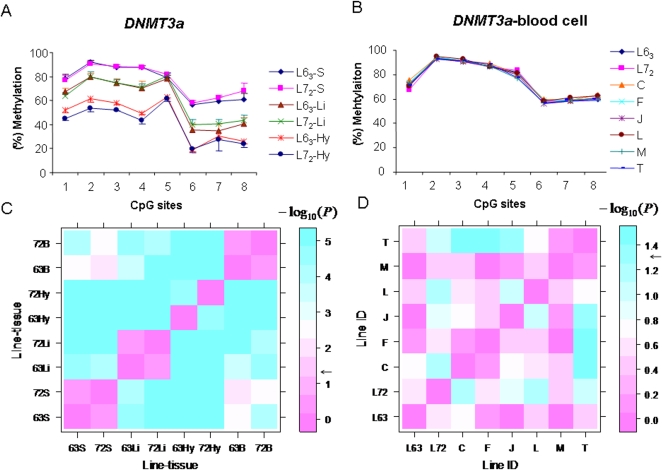
Figure 6. Tissue-specific DNA methylation variations and patterns analysis of DNMT3a in spleen, liver and hypothalamus (A) in line 63 and line 72, and in blood cell (B) in two lines and six RCSs, C, F, J, L, M and T.
L63: line 63; L72: line 72. S, spleen; Li: liver; Hy: hypothalamus. n = 5 for each line and RCS. C. P values matrix among lines and tissues using exact F test for DNA methylation patterns of DNMT3a. 63: line 63; 72: line 72. n = 5 for each. D. P values matrix for DNA methylation patterns of DNMT3a among two parental lines 63 and 72, as well as six RCSs. n = 5 for each. Color bar shows the extent of significance level (P values with −log 10(P). e.g., −log 10(0.05) = 1.3; −log 10(0.01) = 2). Black arrows show P = 0.05.

