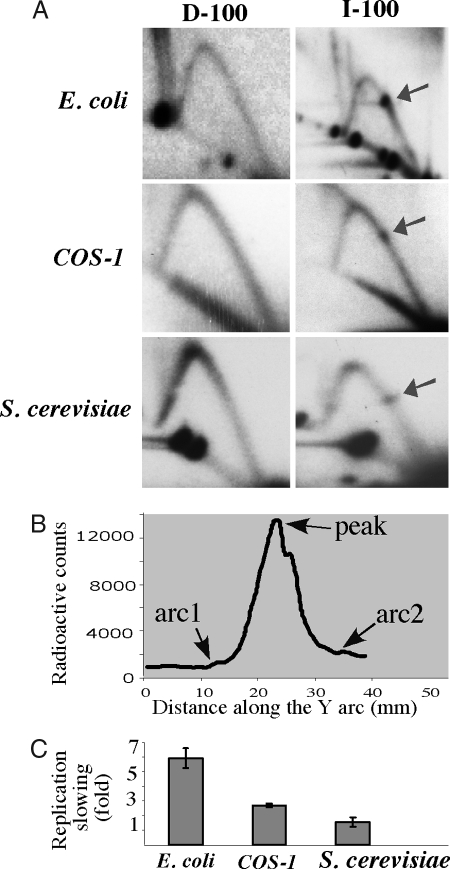
Fig. 2.
Replication forks stall at inverted Alu repeats in E. coli, S. cerevisiae, and COS-1 cells (A) 2D gels showing replication through direct (D-100) and inverted (I-100) Alu repeats with 100% sequence homology in E. coli, COS-1 cells, and S. cerevisiae. Arrows indicate replication stall sites. (B) Radioactive signal along the Y arc containing a replication stall site. The strength of the replication slowing was measured as the ratio between the maximum radioactive count at the stall site (peak) and that at the smooth arc (average between two flanking points on the Y arc, arc1 and arc2). (C) Quantitative analysis of the replication stalls shown in A.

