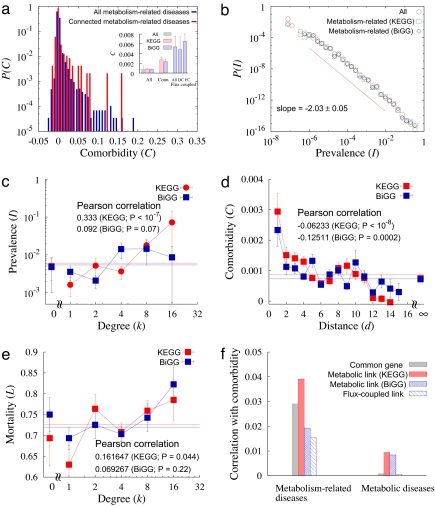
Fig. 3.
Comorbidity and the human MDN. (a) Comorbidity distributions for all pairs of metabolism-related diseases and for connected diseases. (Inset) The average comorbidities. (b) Distribution of the prevalence of metabolism-related diseases, well approximated by a power–law with exponent −2.03 ± 0.05 (see red line). (c) Prevalence as a function of the degree of the disease in the MDN. The prevalence increases with the degree with the PCC 0.333 for KEGG database and 0.092 for BiGG database with P values <10−7 and ≈0.07, respectively. (d) Comorbidity as a function of the distance between diseases in the MDN, decreasing as the distance increases. The PCCs are −0.06233 and −0.12511 for the KEGG and BiGG databases, respectively, and the P values are <10−8 for KEGG and ≈0.0002 for BiGG database. (e) Mortality as a function of disease degree in the MDN. The mortality increases with the degree with the PCC 0.162 for KEGG database and 0.0693 for BiGG database with P values 0.044 and 0.22, respectively. (f) Correlation of potential disease comorbidity factors with disease comorbidity. PCCs between the presence of common associated genes, of metabolic links, and of flux-coupled links, with disease comorbidity are presented for metabolism-related diseases and classical metabolic diseases.

