Fig. 2.
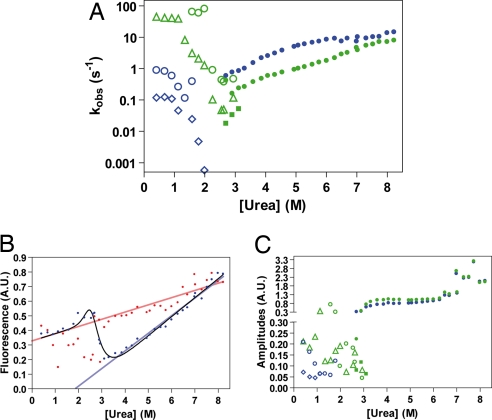
Urea dependence of the kinetics monitored by stopped-flow fluorescence. (A) Urea dependence of the observed rate constants. Closed symbols indicate unfolding experiments; open symbols indicate refolding experiments. Phases associated with an increase in fluorescence for unfolding and a decrease for refolding are in blue. Phases associated with a decrease in fluorescence for unfolding and an increase for refolding are in green. (B) End-point analysis. Starting points (point at t = 0 s as estimated from the curve fit) are in red, end points (point at t = ∞ as estimated from the curve fit) are in blue. The urea dependence of the fluorescence of the native state and the unfolded state is shown by red and blue lines, respectively. The urea dependence of the end points resembles the fluorescence-monitored equilibrium denaturation curve (solid line). (C) Urea dependence of the amplitudes, colors as in A.

