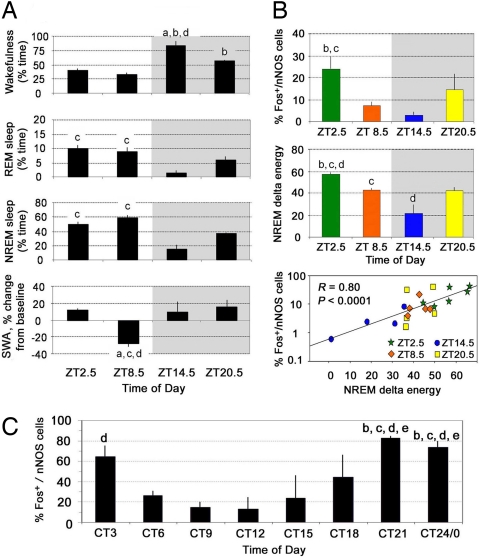
Fig. 3.
Sleep parameters and Fos expression in nNOS-ir neurons of mouse and hamster cortex during spontaneous sleep and wakefulness. (A) Mice were killed at four time points across the light/dark cycle; sleep/wake amounts and EEG SWA levels were calculated for the 2.5-h period before they were killed. Statistical comparisons were made among all groups; letters at the top of bars indicate significant differences (P < 0.05) compared with the time bins indicated [from left to right: a–d in mice (A and B) and a–h in hamsters (C)]. Thus, the amount of wakefulness was significantly higher in the dark period (shaded) at ZT14.5 than during the light period (nonshaded) at ZT2.5 or ZT8.5. Conversely, the amounts of NREM and REM sleep were significantly higher during the light (ZT2.5 and ZT8.5) than during the dark at ZT14.5. SWA was significantly lower at ZT8.5 than at ZT2.5, 14.5, or 20.5. (B) Although sleep amounts were similar at ZT2.5 and ZT8.5, the percentage of Fos+/nNOS-ir cells was significantly higher at ZT2.5 than at ZT8.5 and thus paralleled the high levels of SWA. Across all groups, the percentage of Fos+/nNOS-ir cells in the mouse cortex was highly correlated with NREM delta energy (the relationship is presented here as a semilog plot). (C) In hamsters killed after exposure to constant light for at least 2 weeks, the profile of Fos expression in nNOS-ir cells was similar to that in mice: The highest percentage of Fos+/nNOS-ir cells was found at CT3 during the inactive phase when EEG SWA is high and the lowest proportion at CT9–12 when EEG SWA is low. During the active phase, the proportion of Fos+/nNOS-ir cells is low at CT15 and increases because sleep debt accumulates late in the active phase (CT21–24). Data are shown as mean ± SEM.

