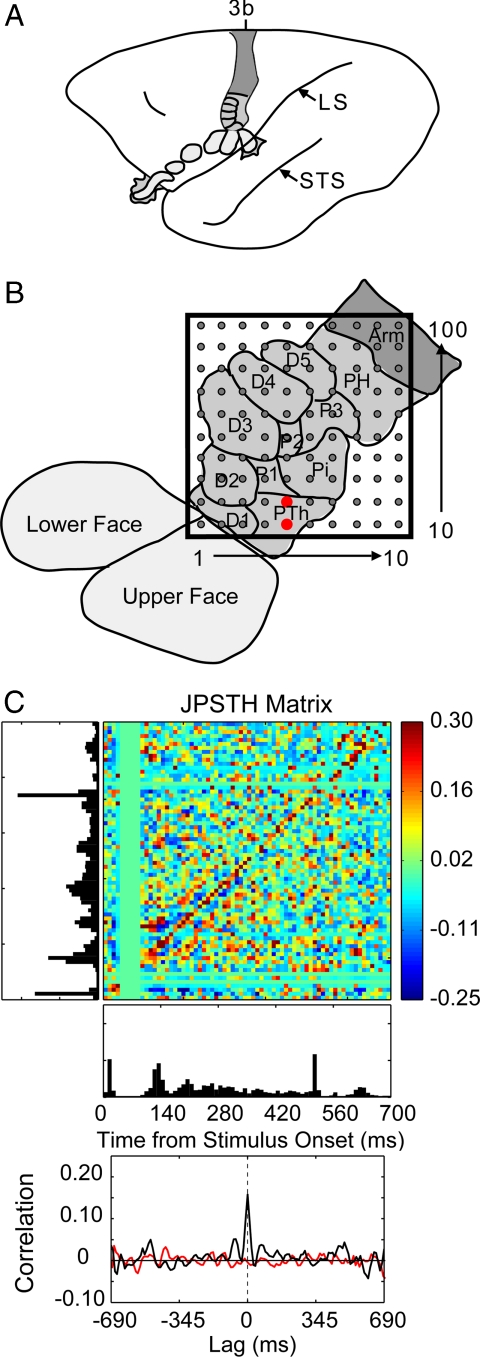
Fig. 1.
An example of correlated spike activity recorded from two adjacent electrodes in monkey 1. (A) A lateral schematic view of an owl monkey brain with area 3b shaded. Subdivisions representing the face and hand are outlined, including those that cannot be seen from a surface view. LS, lateral sulcus; STS, superior temporal sulcus. (B) The location of the array within the area 3b hand representation. The approximate representations of the digits (D1–5) and the digital (P1–3), thenar (PTh), hypothenar (PH) and insular (Pi) pads of the hand are identified and outlined. The red dots mark the electrodes where the two neurons were recorded for the analysis shown in C. Both neurons had RFs on the PTh pad. (C) An example of the spike timing synchrony of units recorded from adjacent electrodes. Two probes simultaneously indented the skin on the PTh and P1 pads. Spike synchrony between the two neurons is shown in the normalized joint peristimulus time histogram, the JPSTH matrix. The two PSTHs of the responses to 100 repetitions of 0.5-s skin indentations are shown to the left and below the matrix, with the cross-correlation histogram derived from the JPSTH analysis directly below. The colored pixels in the JPSTH matrix represent the magnitude of the normalized correlation at different lag times over a poststimulus time of 700 ms. Strong spike synchrony occurred around a 0-ms lag time throughout the period. The cross-correlation histogram (black) revealed a peak correlation of 0.16 that exceeded the mean correlation from the shuffled trials (red).

