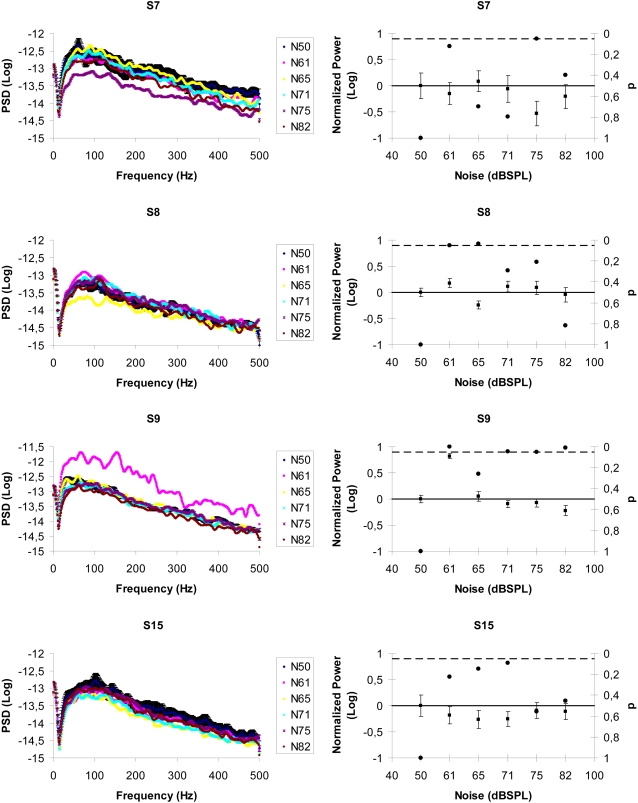
Figure 4. SR interactions between auditory noise and propioceptive signals.
(Left column) average EMG power spectral densities as a function of noise level in four subjects for the tightrope posture position. For clarity only the baseline condition shows error bars (one standard error). (Right column) normalized power in four subjects. Again, the no-noise condition is taken as baseline; the black dots indicate p-values (right y-axis) and the broken line represents the 5% significance level. Error bars correspond to one standard error.

