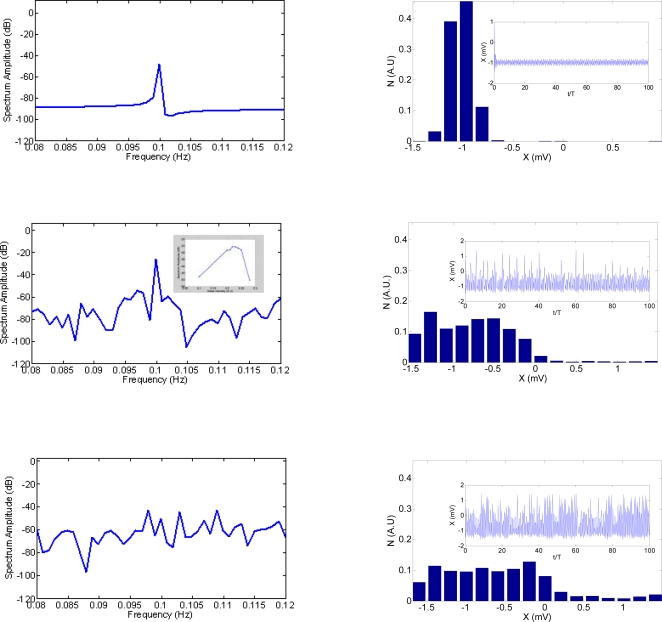
Figure 6. Theoretical model results for unimodal SR.
(Left column) shows the neurons' spectrum amplitude as a function of the noise intensity σ −. The insert (left column, middle row) shows the well-known SR inverted u-shape function. The maximum peak is found when P = 10 dB. Right column shows neuronal firing histograms with their corresponding time histories. T is the signal period and N means the probability to have certain neuronal activity levels.

