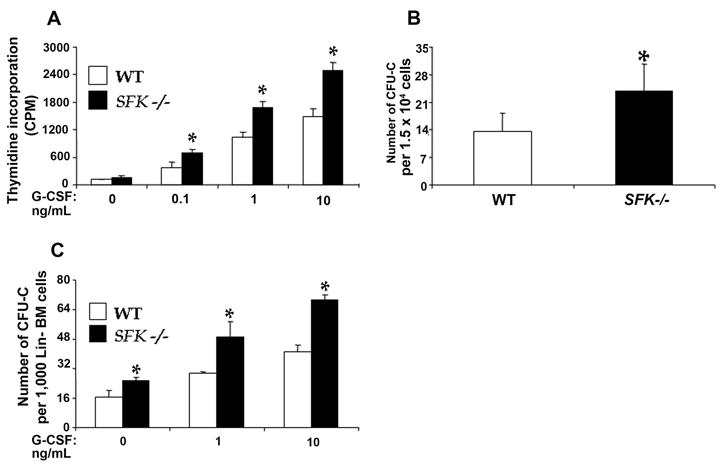
Figure 2. Deficiency of SFKs in hematopoietic stem and progenitor cells results in hypersensitivity to G-CSF.

(A) Low density mononuclear cells (MNCs) were cultured in the presence of increasing concentration of G-CSF. After 48 hours and six hours prior to harvesting, cells were pulsed with [3H] thymidine. Proliferation was measured by thymidine incorporation (counts per minute). Bars denote the mean of four independent experiments. *P<0.05, WT vs SFK−/−. (B) Low density MNCs were harvested and plated in a methylcellulose assay with 10 ng of G-CSF. Colonies were scored 7 days later. Bar graph shows the mean of four independent experiments done in triplicates. *P<0.05, SFKs −/− vs WT. (C) Lineage negative cells were plated in a methylcellulose assay with varying concentrations of G-CSF. Colonies were scored 7 days later. Bars represent the mean colony forming ability from an independent experiment. *P<0.05, SFKs −/− vs WT.
