
Fig. 9.
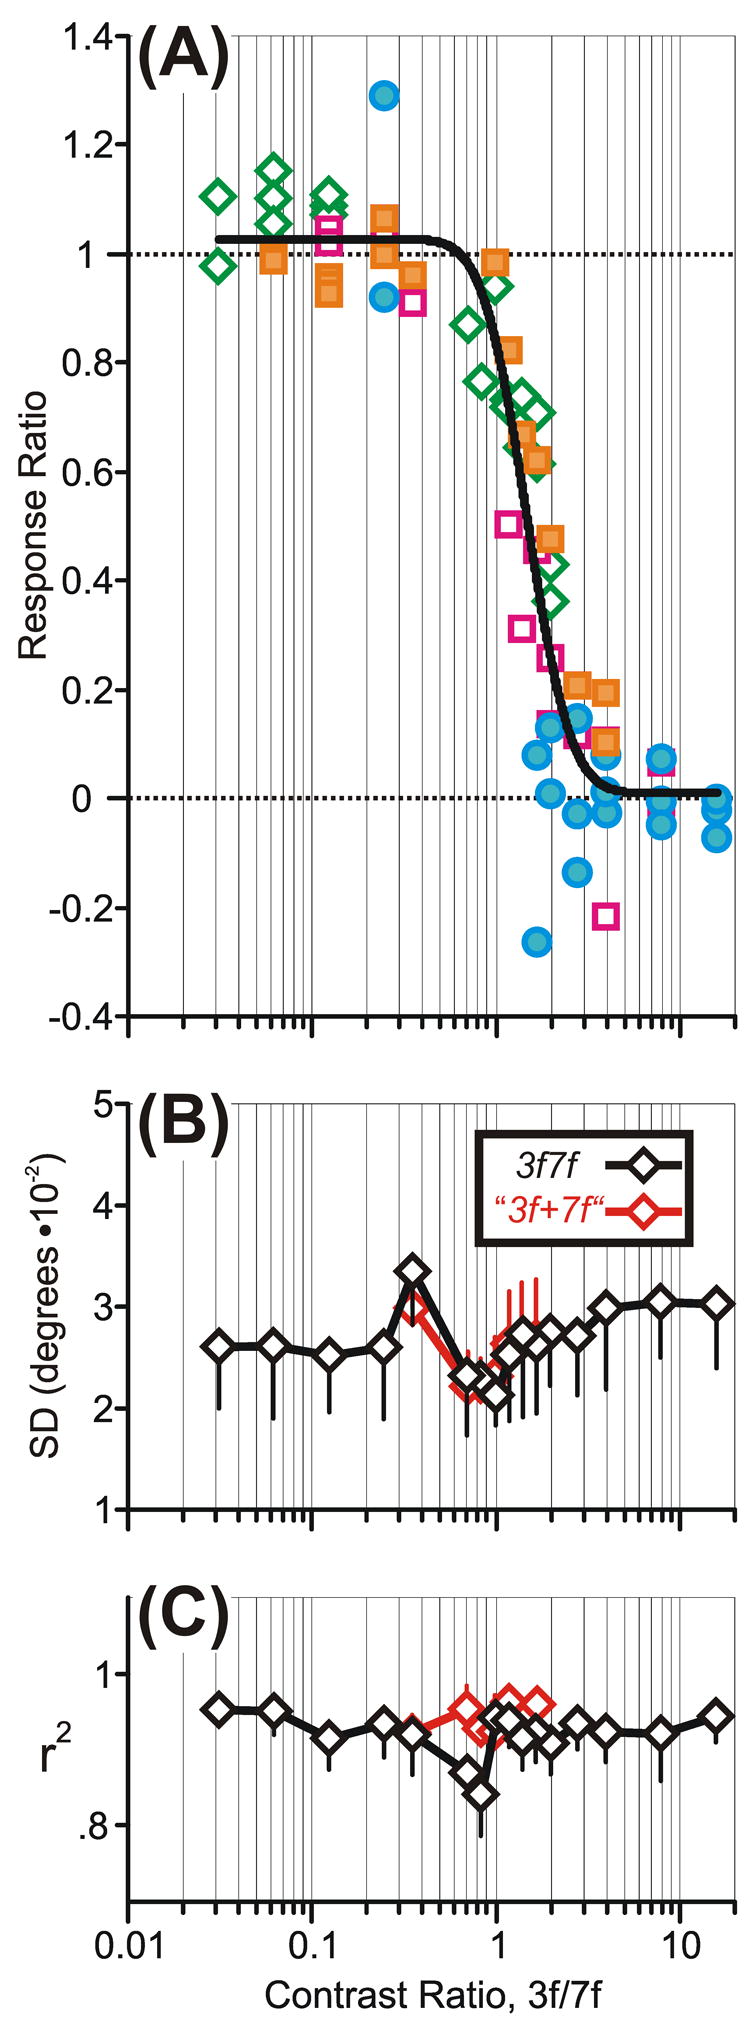
The initial OFRs to the 3f7f stimuli: dependence of the Response Ratio on the Contrast Ratio, 3f/7f (selected pooled data for three subjects from Fig. 8). A: Response Ratios when the amplitude/contrast of the 3f component was varied systematically while the amplitude/contrast of the 7f component was fixed at 4% (blue filled circles), 8% (magenta open squares), 16% (orange filled squares), and 32% (green open diamonds); continuous smooth curve is best-fit Cumulative Gaussian function. B: Dependence of the mean Standard Deviations of the “best-fit Gaussians for the response distributions to individual 3f7f stimuli” on the Contrast Ratio (actual data in black, simulated winner-take-all data in red). C: Dependence of “the mean r2 values of the best-fit Gaussians for the response distributions to individual 3f7f stimuli” on the Contrast Ratio (actual data in black, simulated winner-take-all data in red). Error bars, SD.