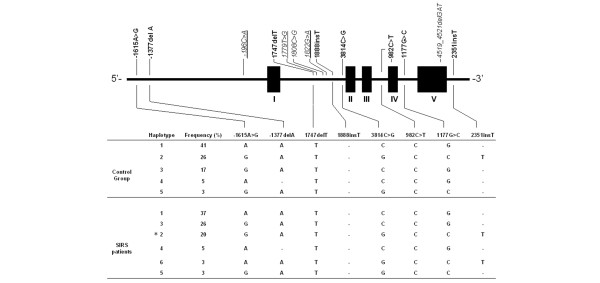
Figure 1.
Schematic illustration of the high mobility group box 1 protein gene locus. The most common inferred haplotypes (frequency > 3%) in both the control population and the systemic inflammatory response syndrome (SIRS) population are shown. Modified from Ferrari and colleagues [41]. Bold, location of polymorphisms; italic, location of mutations; underline, mutations only found in the control population; solid boxes, exons I to V. *Haplotype was statistically more frequent in the SIRS population (P = 0.006) as compared with the control population.

