
Figure 1.
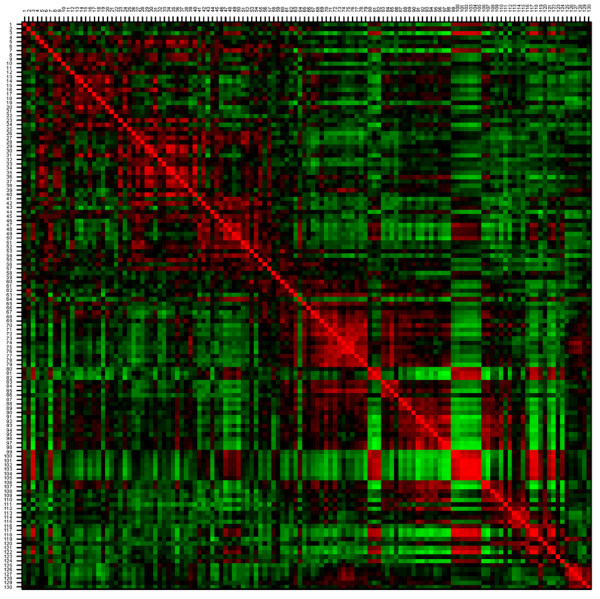
Graphical representation of Spearman correlation matrix of 130 surface-enhanced laser desorption/ionization time-of-flight mass spectrometry peaks. Red color intensity, positive correlation; green color intensity, negative correlation.
Official websites use .gov
A
.gov website belongs to an official
government organization in the United States.
Secure .gov websites use HTTPS
A lock (
) or https:// means you've safely
connected to the .gov website. Share sensitive
information only on official, secure websites.
Graphical representation of Spearman correlation matrix of 130 surface-enhanced laser desorption/ionization time-of-flight mass spectrometry peaks. Red color intensity, positive correlation; green color intensity, negative correlation.