
Figure 2.
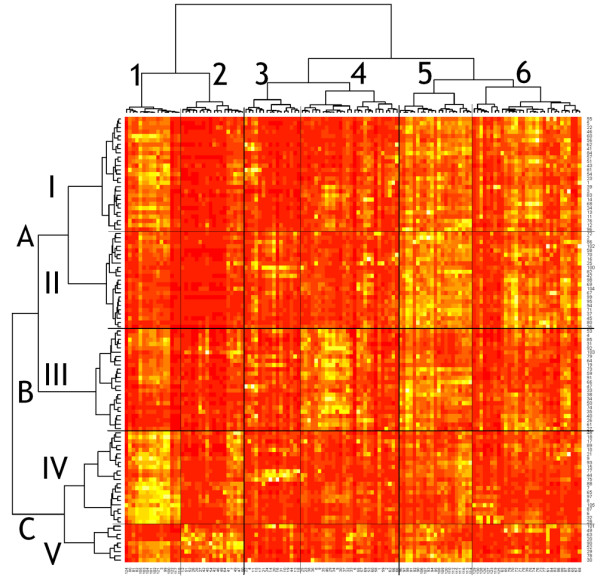
Result of hierarchical clustering in the form of a heat map of peak values. Rows represent 105 individual patients and columns represent 130 peaks used for the analysis. The value of the peak is indicated by the color intensity. Unsupervised hierarchical clustering revealed two (not labeled), three (labeled A, B, C), five (labeled I to V) and six (labeled 1 to 6) groups of patients.