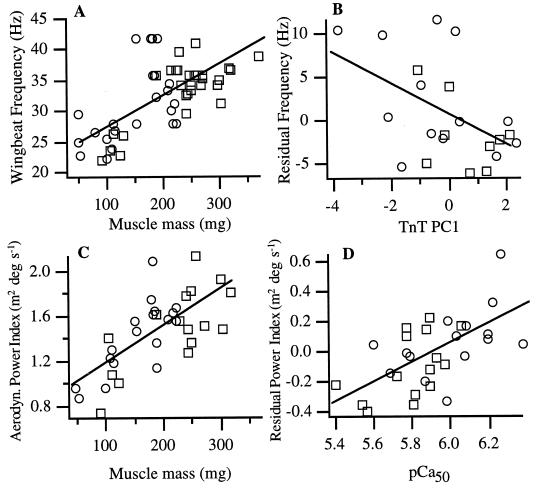
Figure 4.
Relationships between total flight muscle mass and wing-beat frequency (A) and relative aerodynamic power output (the product of wing area, wing-beat amplitude, and frequency; C). The first principal component of TnT transcript relative abundances (TnT PC1; B) explains a significant portion of the residual variation in wing-beat frequency after accounting for variation in muscle mass. Calcium sensitivity explains a significant portion of residual variation in relative power output (D). Sample sizes vary because not all of the variables (or components thereof, such as wing-beat amplitude) were measured from all dragonflies. Symbols are as in Fig. 2 B–D.

