
Figure 6. LFA-1 and Lck 3D localization on Db-GP(33–41)-specific T cells in the CNS.
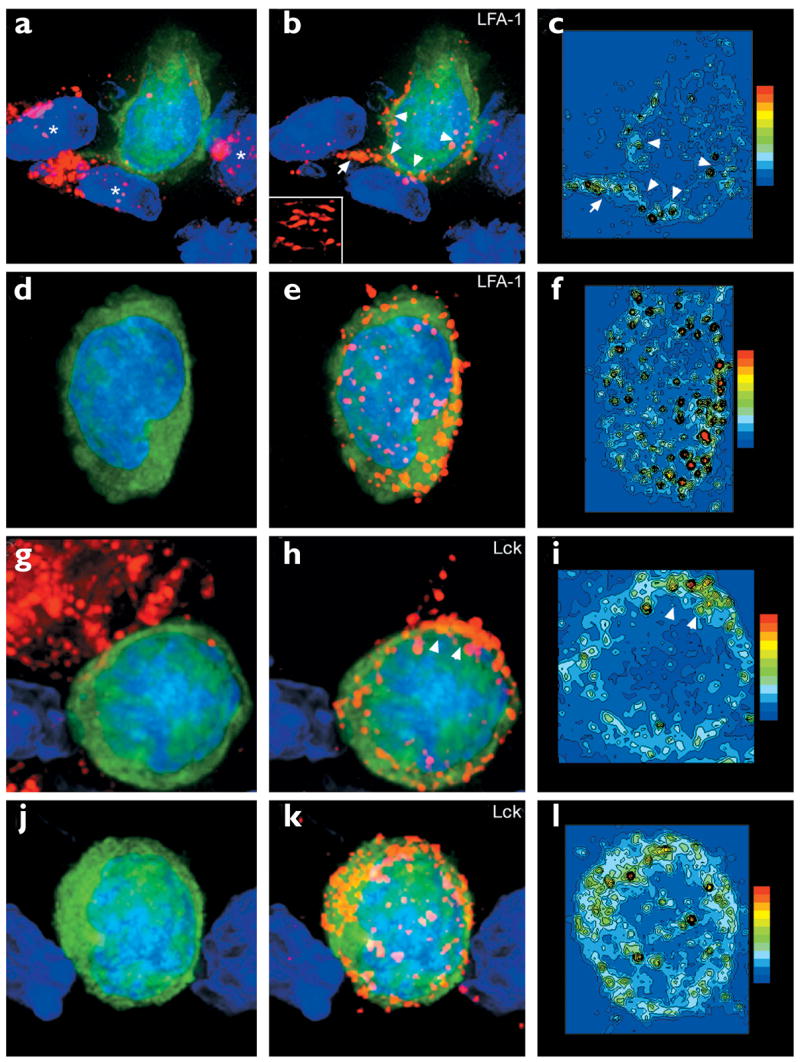
Maximal projections of 3D datasets show the total cellular distribution of (a–f) LFA-1 and (g–l) Lck, which was examined on both CNS (a–c, g–i) conjugates and (d–f, j–l) nonconjugates. Pseudocolored contour plots show the distribution of (c,f) LFA-1 and (i,l) Lck on the GFP+ Db-GP(33–41)-specific T cells.All maximal projections showed Db-GP(33–41)-specific T cells (green) and nuclei (blue). The left-hand panels show the virus in red; the middle panels show LFA-1 or Lck in red. (a) A Db-GP(33–41)-specific T cell in juxtaposition with at least three LCMV-infected targets (asterisks). (b,c) Polarization of LFA-1 was observed at the interface with each of these virus-infected targets (arrowheads) and on a process that extended from the CTL (arrow). (b) Inset shows the distribution of LFA-1 at the interface with one of the virus-infected targets. (d–f) A nonconjugate in the CNS; (e,f) note the presence of evenly distributed LFA-1 clusters around the cell membrane. (g) Another CTL–target cell conjugate. (h,i) Lck aggregation was observed at the interface between the CTL and the virus-infected target (arrowheads). (j–l) A more homogenous distribution of Lck was observed on nonconjugates.