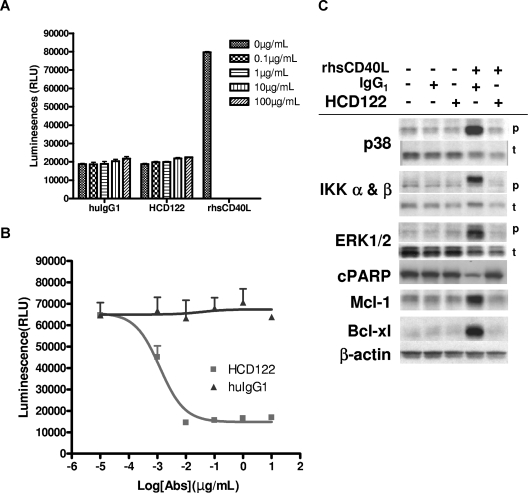
Figure 5.
Inhibition of CD40L-induced B-CLL cell survival and proliferation. Responses of B-CLL cells to stimulation by CD40L, and inhibition of the responses by HCD122, are shown for a single representative patient. (A) B-CLL cells were cultured in concentrations of 0 to 100 μg/mL either HCD122 or huIgG1, or in 1 μg/mL rhsCD40L + 2 μg/mL enhancer for 72 hours. (B) B-CLL patient cells were cultured for 72 hours in 1 μg/mL rhsCD40L + 2 μg/mL enhancer with 0 to 10 μg/mL either HCD122 or huIgG1. Cell viability was measured as luminescence intensity (RLU = relative light units). Values represent mean (± SD) of triplicate measurements. (C) Effects of CD40L and HCD122 were evaluated on a number of signaling pathways and antiapoptotic proteins. As indicated by + signs above the figure, CLL cells were incubated in 10 μg/mL HCD122 or 10 μg/mL IgG1 isotype control and 2 μg/mL CD40L (rhsCD40L) for 20 minutes (α and β IKK and ERK) or 24 hours (p38, cPARP, Mcl-1, Bcl-xl). Western blot analysis was performed using antibodies as listed on left-hand side of the panel. β-Actin was used to ensure equal loading of protein in all lanes and is shown as an example for Bcl-xl. For each protein analyzed, representative samples are shown. p indicates phospho-protein; t, total protein.

