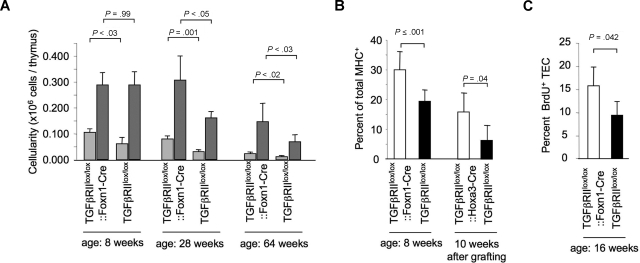
Figure 3.
The composition, phenotype, and proliferation of the thymic epithelial compartment are altered in TGFβRIIlox/lox::Foxn1-Cre mice. (A) TEC cellularity in TGFβRIIlox/lox::Foxn1-Cre and TGFβRIIlox/lox littermates at the indicated ages. Data are given for TECs expressing either high ( ) or intermediate (
 ) MHC cell surface concentrations. Total TEC cellularity at the age of 8 weeks: 0.39 (± 0.06) × 106 cells (TGFβRIIlox/lox::Foxn1-Cre) versus 0.35 (± 0.07) × 106 cells (TGFβRIIlox/lox, P = .36 derived from a t test, with 6 and 4 mice per group, respectively); at the age of 28 weeks: 0.389 (± 0.100) × 106 cells (TGFβRIIlox/lox::Foxn1-Cre) versus 0.192 (± 0.031) × 106 cells (TGFβRIIlox/lox, P = .02 derived from a t test, with 4 and 3 mice per group, respectively); and at the age of 64 weeks: 0.166 (± 0.073) × 106 versus 0.080 (± 0.029) × 106 (P < .015 derived from a t test, with 4 and 6 mice per group, respectively). This analysis was performed at least twice with similar results. (B) Fraction of MHCIIhigh TECs in comparison with total TECs (CD45+MHCII+). TECs derived from TGFβRIIlox/lox::Foxn1-Cre (8 weeks of age) and TGFβRIIlox/lox::Hoxa3-Cre (10-12 weeks after transplantation) mice show similar increases in the MHCIIhigh fraction in comparison with Cre-negative littermate controls. (C) Spontaneous proliferation of TECs isolated from TGFβRIIlox/lox::Foxn1-Cre and TGFβRIIlox/lox mice (16 weeks of age) as measured by the fraction of BrdU-incorporating TECs. One representative experiment of 2 with 4 or more animals in each group is shown. P value was obtained using a t test. Error bars represent SD.

