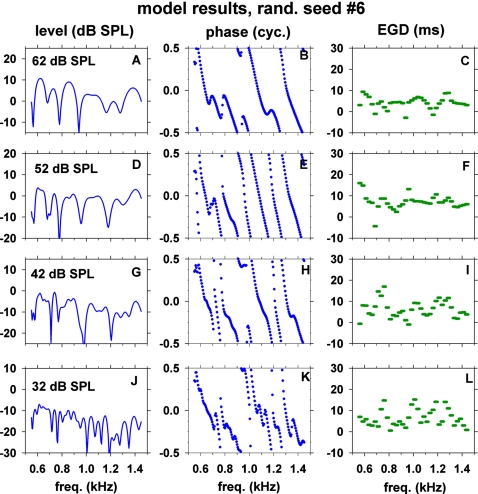
Figure 10.
(Color online) SFOAE fine structures of the model obtained with random seed No. 6 for the cochlear-partition impedance irregularity. The three columns correspond to the model SFOAE level, phase and energy-weighted group delay (EGD) versus frequency. The four rows correspond to four stimulus levels indicated in the insets. The model parameters were set to the optimal values described in Table 6.

