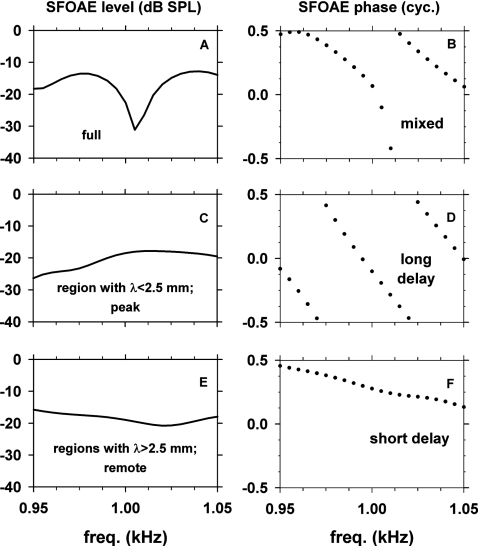
Figure 15.
Level and phase of the model SFOAE at 32 dB SPL versus frequency over a narrow range of frequencies (950–1050 Hz) obtained with three types of spatial profiles of the cochlear-partition impedance irregularity: fully present (top), restricted in a region around the traveling-wave peak with λ<2.5 mm (middle) and in regions remote from the peak with λ>2.5 mm (bottom).

