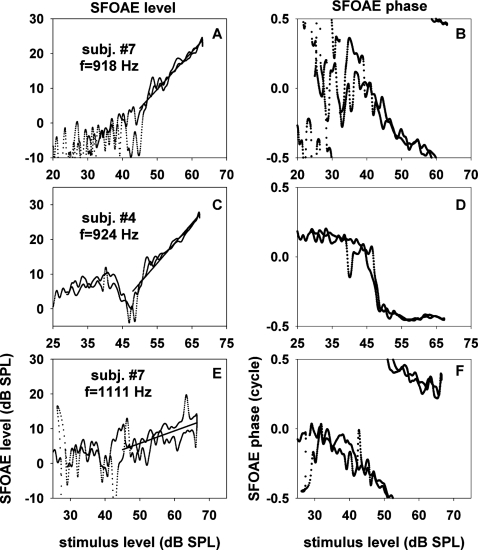
Figure 7.
SFOAE level and phase versus stimulus level for “trough stimulus frequencies.” The latter were defined to be stimulus frequencies corresponding to troughs of SFOAE level versus frequency at 52 dB SPL. The three rows correspond to data from three different cases; the subject identification numbers and the selected stimulus frequencies are shown in the insets. The portions of the input-output functions of SFOAE level, where slopes could be ascertained, were fitted with straight lines. The slopes of the fitting lines were 1.08, 1.15, and 0.36 dB∕dB for panels A, C, and E, respectively.

