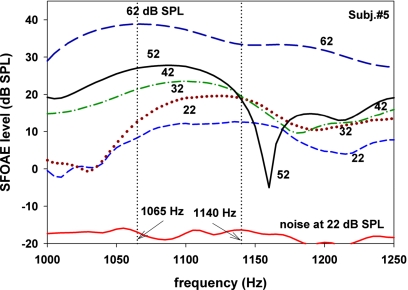
Figure 8.
(Color online) An example illustrating that a peak of SFOAE level shifted as a function of stimulus level. As the stimulus level increased, the position of the peak shifted to a lower frequency. The data also illustrate the fact that SFOAE level for a frequency near a trough (1160 Hz) can be a nonmonotonic function of stimulus level. The lowest curve shows noise floor at 22 dB SPL.

