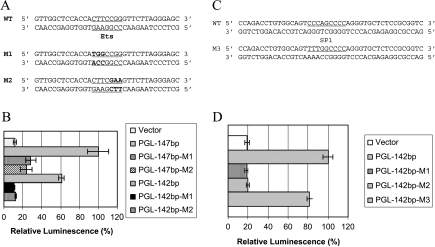
Figure 4.
Mutational analysis of Ets and Sp1 elements. (A and C) DNA sequences of the wild type and the mutated Ets or Sp1 sequences. The underlined sequences are either the Ets or the Sp1 sites, and the nucleotides in bold are the mutated nucleotides. (B and D) H1299 cells transfected with the indicated constructs, and luciferase activities were analyzed 24 hours after transfection. Data are representative of three independent experiments.

