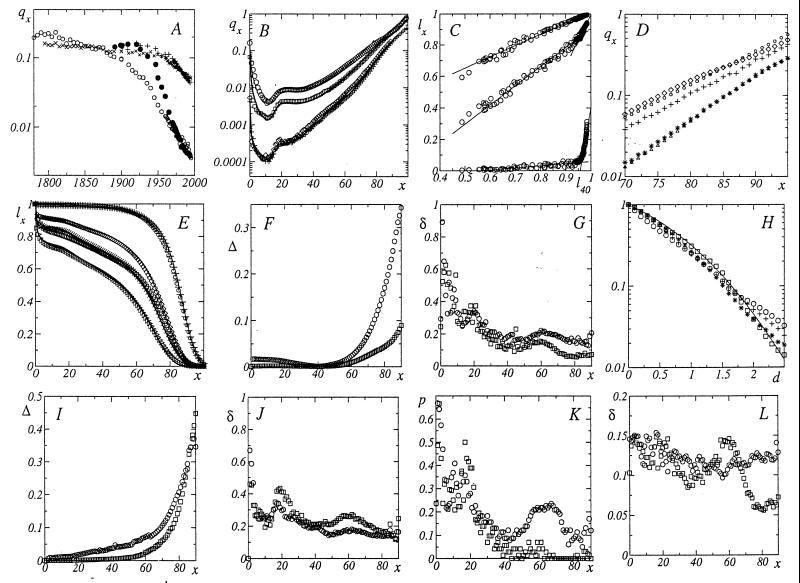
Figure 1.
(A) Evolution of mortality rate (at birth, q0 and at 80 years, q80) with chronological year for Swedish (q0, O, q80, x) and Japanese (q0, ●; q80, +) females. (B) Agreement between theoretical and lifetable mortality rates qx (in all cases the age x is in years) for 1891/1898 Japanese (O, q0 = 0.1612), and 1926/1930 Swedish (□, ℓ40 = 0.81) males; 1992/1994 German (⋄, q0 = 0.0515), and 1990 Japanese (+, ℓ40 = 0.983) females. The calculations according to the data in brackets are presented by thick lines for Eqs. 1–3 and thin lines for Eqs. 3–5. (C) Evolution of the survival probability ℓx with ℓ40 for 1891–1995 Swedish (10, 11), 1891–1990 Japanese (10), and 1871–1992 German (13) males and females. The ages x = 20, 60, and 90 yield upper, middle, and lower curves, respectively. Solid lines are linear approximations. Note a rapid and nearly simultaneous, for different ages, change in the slope at ℓ40 ≅ 0.97. (D) Evolution of the mortality curve in the vicinity of ℓ40 ≅ 0.97: 1947 Japanese female (O, ℓ40 = 0.709); 1960 Japanese (⋄, ℓ40 = 0.897) and 1980 Swedish (+, ℓ40 = 0.959) males; 1995 Swedish (∗, ℓ40 = 0.897), and 1990 Japanese (Δ, ℓ40 = 0.983) females. (E) Agreement between theoretical and life table survival probabilities ℓ40 for 1891/1898 Japanese males (▹, ℓ40 = 0.582); 1891/1900 Swedish (□, ℓ40 = 0.695), and 1947 Japanese (X, ℓ40 = 0.709) females; 1926/1930 Swedish males (⋄, q0 = 0.0668); 1990 Japanese (+, q0 = 0.00418), and 1995 Swedish (O, q0 = 0.00358) females. Calculations according to Eqs. 1 and 2 and 3–5 are presented by thick lines for Eqs. 1-3 and thin lines for Eqs. 3–5. (F) Accuracy of the universal survival law: mean square deviations Δ1(O), and Δ2 (□) of Eqs. 1 and 2 from experimental data (10-13). (G) Accuracy of the universal survival law: mean square deviations δ1 (O) and δ2 (□) of Eqs. 1–3 from experimental data. (H) Accuracy of the universal survival law: probability (on a semilogarithmic scale) of relative (with respect to their mean quadratic values) deviations exceeding d for Eqs. 1–3 (O for ℓx + for qx) and for Eqs. 3–5 (□ for ℓx, ∗ for qx). The probability of random fluctuations is presented by the solid line. (I) Same as in F, but for Eqs. 4 and 5. (J) Same as in G, but for Eqs. 3–5. (K) Probability P of |q̃x − qx|/qx > 0.25 for Eqs. 1 and 3 (O) and Eqs. 2 and 3 (□) vs x. (L) Same as in G, but for life tables with |q̃x − qx|/qx < 0.25 only.

