
Figure 1.
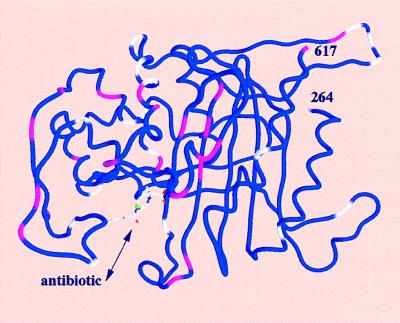
Worm representation of the transpeptidase domain of PBP2x (residues 264–617). The worm is color-coded with colors representing the mutation probability in clinically produced resistant sequences, with blue (0), white (between 0 and 0.75), and pink (higher than 0.75) at the Cα position. The mutation probability is based on the analysis of 26 sequences of resistant PBP2x produced by clinical isolates. Secondary structure elements are shown as in figure 3b of ref. 8. A cephalosporin molecule is modeled in the active site.