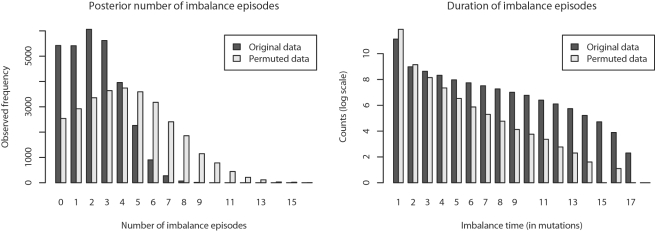
Figure 6. Episodes of imbalance in Yersinia.
Left: The Bayesian posterior distribution of the number of imbalance episodes occurring entirely on branches of reconstructed inversion phylogenies, compared with permuted data. Right: Posterior distribution of the imbalance episode duration (in mutation events) observed on branches, compared with data permuted as described in the text. From the two plots we can conclude that transitions to imbalance are less frequent than expected under a null model, and that imbalance episodes last longer than expected under the null model.

