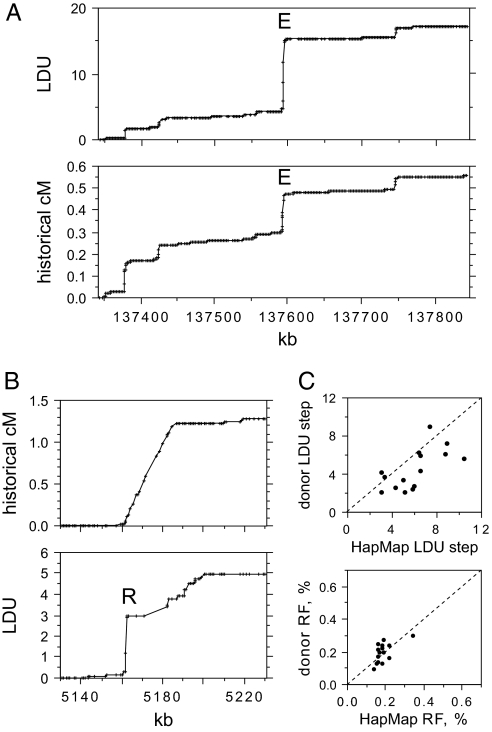
Fig. 1.
Identifying strong candidate recombination hotspots from genotype data. (A) Metric LD map of a 500-kb region of chromosome 8 determined from Phase II HapMap genotypes of 60 unrelated CEU individuals compared with the historical recombination map estimated by coalescent analysis of the same data and shown below (data in cM taken from HapMap). The strong LD hotspot E is marked. (B) Similar analysis of a 100-kb interval on chromosome 20 containing the strongest LD hotspot reported by HapMap (16). (C) LDU step sizes and historical recombination activity at the 15 strong LD hotspots A–Q selected for sperm cross-over analysis, estimated from Phase II HapMap data and from genotypes of 94 north European semen donors. HapMap and donor LDU steps were both estimated across the same 15-kb interval genotyped in donors. LD hotspot R was omitted because of uncertainties in historical activity (B) and lack of markers preventing HapMap LDU step estimation in the 15-kb interval.

